[코인] 거대한 하강 삼각지대에서 비트코인 거래가 이루어지고 있는가? / Is Bitcoin trading in a Giant…
 코인개미
0
1945
2021.10.01 09:20
Bitcoin / U.S. Dollar
ScotianBot
On the RSI there appears to be a noticeable divergence, there's a series of higher lows forming an ascending triangle .
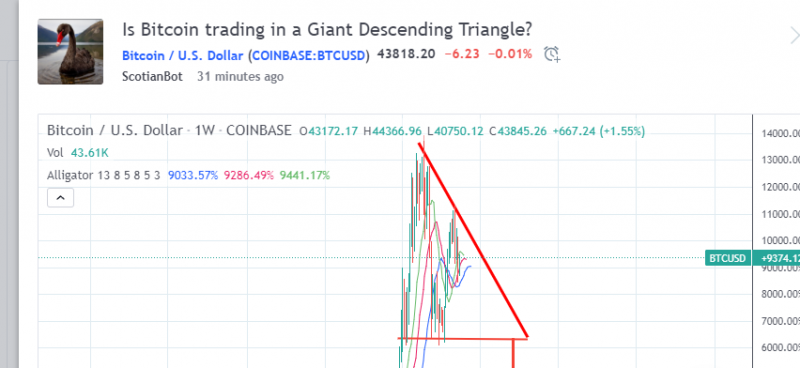
The price is displaying a series of lower highs forming a descending triangle .
A bullish divergence or bearish divergence?
A bullish divergence occurs when prices fall to a new low while an oscillator fails to reach a new low. This situation demonstrates that bears are losing power, and that bulls are ready to control the market again—often a bullish divergence marks the end of a downtrend.
Bearish divergences signify potential downtrends when prices rally to a new high while the oscillator refuses to reach a new peak. In this situation, bulls are losing their grip on the market, prices are rising only as a result of inertia, and the bears are ready to take control again.
On the KST there has been a bearish cross on a 1-year chart. In this 5-year chart, it appears as though a bearish cross is on the verge of occurring near term on the Williams alligator .
It's always possible this pattern plays out as a Giant Bullish Flag , expect to see a re-test of the baseline of support & possibly a fake-out to the downside before breaching the horizontal resistance and re-testing ATH's.
번역:
비트코인/미국 달러
스코션봇
RSI에는 뚜렷한 차이가 있는 것으로 보이며, 상승 삼각형을 형성하는 일련의 높은 최저점이 있습니다.
가격은 내리막 삼각형을 형성하며 일련의 낮은 고도를 나타내고 있다.
강세 격차인가 아니면 약세 격차인가?
강세 격차는 진동기가 새로운 최저치에 도달하지 못하는 동안 가격이 새로운 최저치로 떨어질 때 발생한다. 이러한 상황은 약세들이 힘을 잃고 있고, 강세들이 다시 시장을 지배할 준비가 되어 있다는 것을 보여줍니다. 종종 강세 격차는 하락세의 끝을 나타냅니다.
약세 격차는 진동자가 새로운 정점에 도달하기를 거부하는 동안 가격이 새로운 최고치로 상승할 때 잠재적인 하락을 의미한다. 이런 상황에서, 강세들은 시장에 대한 지배력을 잃고 있고, 가격은 단지 관성의 결과로 오르고 있으며, 곰들은 다시 지배할 준비가 되어 있다.
KST에서는 1년차트의 약세 크로스가 있었다. 이 5년짜리 차트에서, 그것은 윌리엄스 악어에게 단기적으로 약점 같은 십자가가 발생할 위기에 처한 것처럼 보인다.
이 패턴은 항상 거대한 강세기로서 나타날 수 있고, 수평적 저항을 깨고 ATH를 다시 테스트하기 전에 지지의 기준선을 다시 테스트하고, 아마도 아래쪽으로 가짜로 아웃하는 것을 볼 수 있을 것으로 기대한다.
원문링크: https://www.tradingview.com/chart/BTCUSD/x91CsZNy-Is-Bitcoin-trading-in-a-Giant-Descending-Triangle/
[본문뒤 추가문구] 서학개미 투자포럼 - 해외투자 트렌드의 중심


