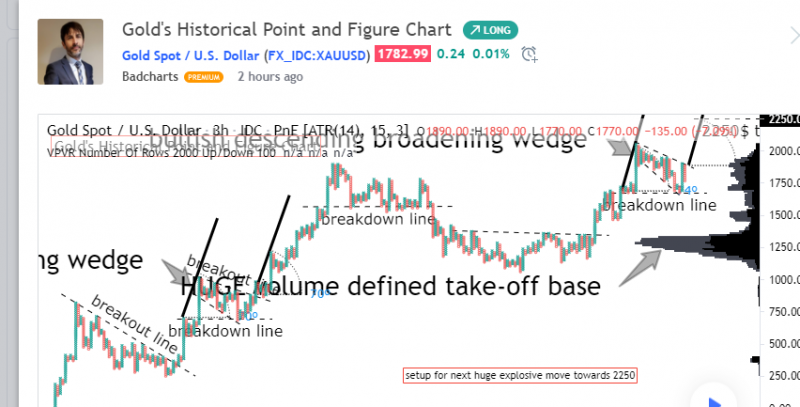
[선물] 금의 역사적 점 및 그림 차트 / Gold's Historical Point and Figure Chart
 선물개미
0
1771
2021.06.22 09:05
Gold Spot / U.S. Dollar
Badcharts
Setup for next huge explosive move towards 2250$ via bullish descending broadening wedge patterns, last seen in 2007-2009
번역:
골드 스폿/미국 달러
배드차트
2007-2009년에 마지막으로 나타난 강세 하강 확대 쐐기 패턴을 통해 2250달러로의 차세대 폭발적 전환을 위한 설정
원문링크: https://www.tradingview.com/chart/XAUUSD/2IxpSiYa-Gold-s-Historical-Point-and-Figure-Chart/
[본문뒤 추가문구] 서학개미 투자포럼 - 해외투자 트렌드의 중심


