[선물] 다음 이동 준비... 30달러가 넘는 / Ready for next Move... past $30
 선물개미
0
1757
2021.08.03 15:43
CFDs on Silver (US$ / OZ)
coreymurphy7288
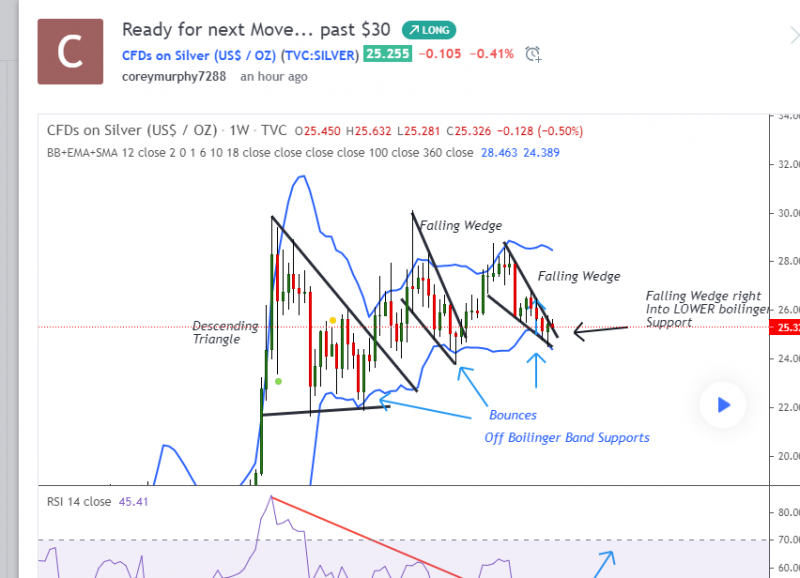
We all seen the ascending wedge that Silver has created over the last year. This chart just gives extra validation to the trade idea with several other sub-indicators, that eventually we are going to break up from here and re-challenge $30 in next few months.
First I have the falling wedge patterns in black. It is a typical bullish reversal pattern, at its resistance is at the 25.65 level currently.
Second, we have the boilinger bands on the weekly. We can see everytime we touch here we get
a nice bullish reversal.
Thirdly, on the RSI , we see a previously overbought reading occuring from the $30 high, getting to 80(+) level to the now current 42 level a year later. the sideways trading movement has allowed price to stabalize at these higher prices, and allowed traders to get used to trading at these higher levels.
We are also starting to gain some energy on the RSI at the bottom can see with the wedge breakout, so that coincides with the other two indicators above that we are bottoming out and ready to move higher.
Lastly, what isn't listed is the COT report open interest. Non-Commercials are long 2:1 on silver and Gold , so that is also a good indicator that silver is bottoming as well and we can be on the precipice of a big move sooner, rather than later.
번역:
은색 CFD(US$ / OZ)
코리머피7288
우리는 모두 실버가 작년에 만든 상승 쐐기를 보았습니다. 이 차트는 다른 여러 하위 지표와의 거래 아이디어에 대한 추가적인 검증을 제공합니다. 결국 우리는 여기서 헤어지고 다음 몇 달 안에 30달러에 재도전할 것입니다.
먼저 떨어지는 쐐기 무늬를 검은색으로 입었습니다. 저항은 현재 25.65 수준인 전형적인 강세 반전 패턴이다.
둘째, 매주 보일러 밴드가 있습니다. 우린 여길 만질 때마다 볼 수 있어
멋진 반전.
셋째, RSI에서는 이전에 과대구입된 판독값이 30달러에서 80달러(+) 수준에서 1년 후 현재 42달러로 상승하는 것을 볼 수 있습니다. 옆으로 거래되는 움직임은 가격이 더 높은 가격으로 안정될 수 있게 했고, 거래자들은 이러한 더 높은 수준에서 거래하는 것에 익숙해질 수 있게 해주었다.
우리는 또한 바닥의 RSI에서 약간의 에너지를 얻기 시작했습니다. 그래서 그것은 우리가 바닥을 치고 더 높이 나아갈 준비가 되어 있다는 위의 다른 두 지표와 일치합니다.
마지막으로, 나열되지 않은 것은 COT 보고서 공개 관심사입니다. 비상업적인 부문은 은과 금에 대해 2:1로 긴 편이기 때문에 은 또한 바닥이 나고 있으며 우리는 조만간 큰 움직임의 벼랑 끝에 설 수 있습니다.
원문링크: https://www.tradingview.com/chart/SILVER/q3ykhISj-Ready-for-next-Move-past-30/
[본문뒤 추가문구] 서학개미 투자포럼 - 해외투자 트렌드의 중심


