[선물] S&P 수정 치트시트 / S&P correction cheat sheet
 선물개미
0
2100
2021.05.14 13:41
S&P 500 E-mini Futures
hectorucf
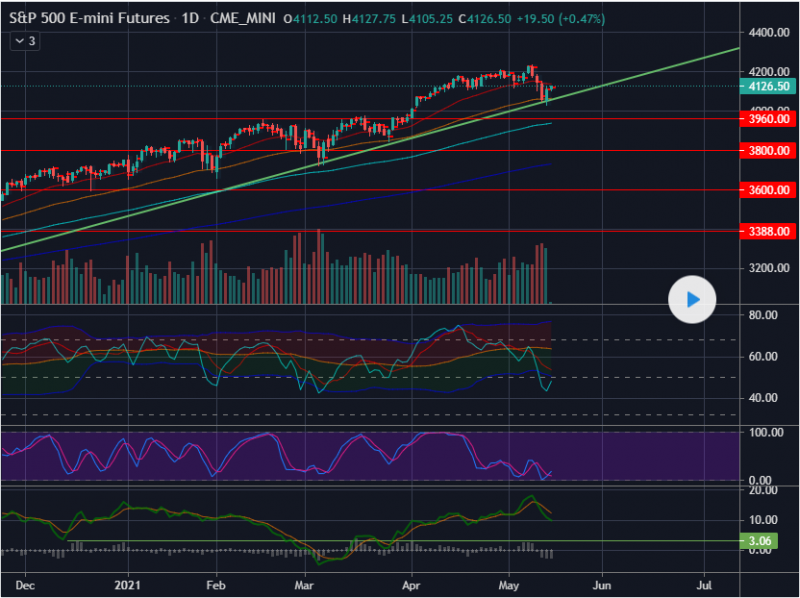
These are the battle lines for the S&P . Green trend line is support. If that breaks with volume , high probability move to first red line - 6.5% correction (mild). If that breaks, next bear target would be second red line - 10% correction (medium). Then third red line is 15% correction (hot), fourth red line is 20% correction (flaming hot). Buy zones are between the 100 and 200 EMAs on the daily chart . 200 - 400 EMAs if ya nasty
번역:
S&P 500 E-mini 퓨처스
헥터쿠프
S&P의 전열전선입니다. 그린의 트렌드라인이 지지합니다. 부피와 함께 파손되면 높은 확률이 첫 번째 빨간색 선 - 6.5% 수정(마일드)으로 이동합니다. 이 값이 부러지면 다음 곰 표적은 두 번째 빨간색 선 - 10% 수정(중간)이 됩니다. 세 번째 빨간색 선은 15% 보정(핫), 네 번째 빨간색 선은 20% 보정(핫 불 붙임)입니다. 구매 구역은 일일 차트에서 100~200 EMA 사이입니다. 심술궂은 경우 200~400 EMA
원문링크: https://www.tradingview.com/chart/ES1!/PRN2pV12-S-P-correction-cheat-sheet/
[본문뒤 추가문구] 서학개미 투자포럼 - 해외투자 트렌드의 중심


