[선물] 추세선을 사용하여 가격 행동 구조/패턴을 식별하는 방법 / How to use trendline to identify…
 선물개미
0
1886
2021.08.30 09:40
Loading the player...
Gold Spot / U.S. Dollar
jojofang0901
Hi everyone:
Many have asked me about how to properly use trendlines to identify price action structures and patterns. So in today’s educational video, I will go over this topic in more detail.
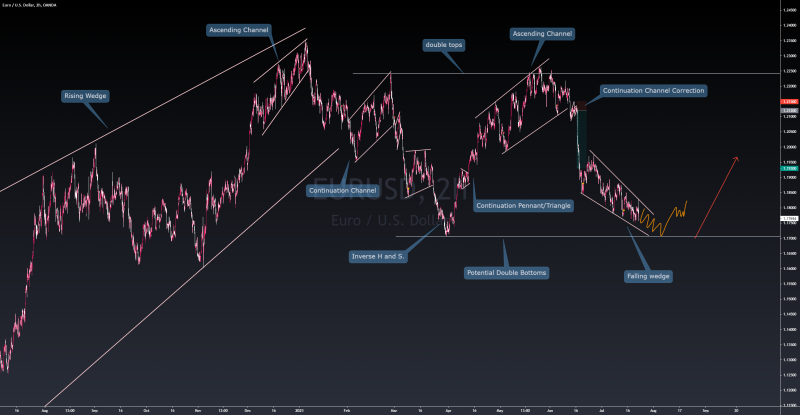
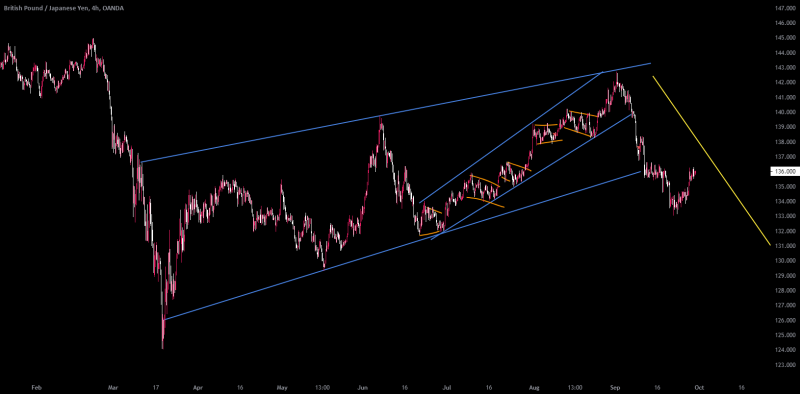
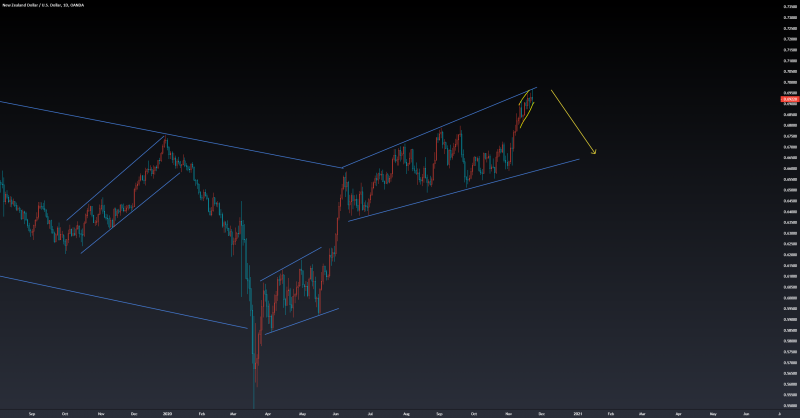
First, I use the trendline as a “frame” to identify structures and patterns, and NOT use it as a Support/Resistance .
What I do is to put in the trendline for the highs and lows of the price action that can help me to pinpoint what the price is doing, what kind of a correctional structure that it is currently in.
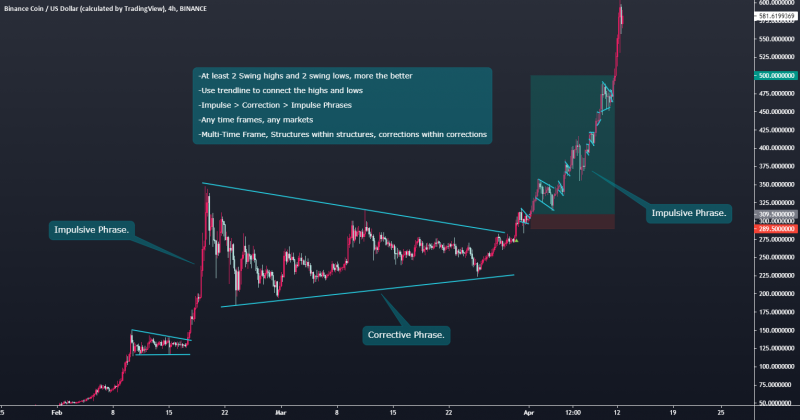
Typically after an impulse phase of the market, then we start to identify a structure/pattern by connecting the swing highs and lows.
Second, as I always point out in my videos/streams, a structure/pattern needs at least 2 swing highs and lows to classify as a structure.
Certainly more swing highs and lows are good, but it's not necessary. Often I get asked about the “third touch” or more. To me it's not necessary, but if price does form the third touch, I would proceed the same as the price has a second touch.
Third, we are identifying the price action correctional structure, and sometimes the market is not perfect, it will not give you a textbook looking bullish flag as an example.
Hence the backtesting and chartwork from each trader is important to get your mind familiarized with the market and its “imperfect” development of the price action.
After identifying the impulse phase, then look to see what the market is doing. Is it falling into a consolidation ?
Not much movement except sideway price action, or ascending/descending like consolidation will give you a clue on whether the price is correcting to continue, or correcting to reverse.
Take a look at the educational videos I have made in the past regarding the type of correctional structures we typically see in the market. All the videos are down below.
Continue to backtest and do chart work to get familiar with drawing in the structures/patterns. The more you do these, the better and easier it is for you to identify them in your trading journey.
Remember, the market is not perfect, so not all the structures/patterns will be “Textbook” like on the real, live market. Learn to deal with the “imperfect” market, so you can better utilize price action analysis to your advantage.
Any questions, comments or feedback welcome to let me know :)
Thank you
Below are all my price action structures/patterns videos on different type of corrections.
Continuation and Reversal Correction
Identify a correction for the next impulse move in price action analysis
Impulse VS Correction
Multi-time frame analysis
Continuation Bull/ Bear Flag
Parallel Channel (Horizontal, Ascending, Descending)
Reversal Ascending/ Descending Channel
Reversal Rising/ Falling Wedge
Reversal Double Top /Bottom
Reversal Head & Shoulder Pattern
Reversal “M” and “W” style pattern
Reversal Impulse Price Action
Continuation/Reversal Expanding Structure/Pattern
번역:
골드 스폿/미국 달러
조조팡0901
안녕하세요 여러분:
많은 사람들이 가격 행동 구조 및 패턴을 파악하기 위해 트렌드 라인을 적절하게 사용하는 방법에 대해 문의해 왔습니다. 그래서 오늘 교육 영상에서는 이 주제를 좀 더 자세히 살펴보도록 하겠습니다.
첫째, 추세선을 "프레임"으로 사용하여 구조 및 패턴을 식별하고 지원/저항으로 사용하지 않습니다.
제가 하는 일은 가격이 무엇을 하고 있는지, 현재 어떤 교정 구조에 있는지 정확하게 파악할 수 있는 가격 행동의 최고와 최저를 위한 추세선을 넣는 것입니다.
일반적으로 시장의 임펄스 단계를 거친 후, 우리는 그네의 높은 부분과 낮은 부분을 연결함으로써 구조/패턴을 파악하기 시작합니다.
둘째, 제가 항상 비디오/스트림에서 지적하는 바와 같이, 구조/패턴을 구조물로 분류하려면 최소 2개의 스윙 하이와 로우(swing high)가 필요합니다.
확실히 더 많은 스윙 하이와 로우도 좋지만, 그럴 필요는 없다. 종종 "세 번째 터치"나 그 이상에 대한 질문을 받습니다. 나에게는 그럴 필요가 없지만, 만약 가격이 세 번째 터치를 형성한다면, 나는 가격이 세 번째 터치를 하는 것과 동일하게 진행할 것이다.
셋째, 가격 행동 교정 구조를 파악하고 있으며, 때로는 시장이 완벽하지 않을 때도 있습니다. 교과서적인 강세 깃발을 예로 들 수 없습니다.
따라서 각 거래자의 백테스트와 차트워크는 여러분의 마음을 시장에 익숙하게 하고 가격 행동의 "불완전한" 발전을 위해 중요합니다.
충동 단계를 파악한 후 시장이 무엇을 하고 있는지 살펴봅니다. 통합에 빠지는 건가요?
사이드웨이 가격 액션 또는 통합과 같은 상승/하강 외에는 별다른 움직임이 없는 경우 가격이 계속 유지되도록 수정되는지 아니면 반대로 수정하는지에 대한 단서를 얻을 수 있습니다.
우리가 시장에서 흔히 볼 수 있는 교정 구조의 종류에 대해 제가 과거에 만든 교육 비디오를 보세요. 모든 동영상은 아래에 있습니다.
구조/패턴의 도면에 익숙해지도록 역테스트를 계속하고 차트 작업을 수행합니다. 이 작업을 많이 수행할수록 거래 과정에서 식별하기가 더 쉽고 좋습니다.
시장이 완벽하지 않기 때문에 실제 실제 시장에서처럼 모든 구조/패턴이 "교과서"가 되지는 않을 것이라는 점을 기억하십시오. "불완전한" 시장에 대처하는 방법을 배워서 가격 행동 분석을 유리하게 활용할 수 있습니다.
질문, 의견 또는 피드백을 환영합니다:)
감사합니다.
아래는 다양한 유형의 수정에 대한 모든 가격 액션 구조/패턴 동영상입니다.
계속 및 반전 보정
19:52
가격 행동 분석에서 다음 임펄스 움직임에 대한 수정 사항 식별
17:21
임펄스 VS 보정
09:26
다중 시간 프레임 분석
08:53
연속 불/베어 플래그
11:11
병렬 채널(수평, 오름차순, 내림차순)
19:55
역오름차순/내림 채널
10:11
역상승/하강 웨지
12:03
위/아래 반전
14:56
반전 헤드 & 어깨 패턴
15:08
반전 "M" 및 "W" 스타일 패턴
12:05
역전 임펄스 가격 액션
13:05
연속/역방향 확장 구조물/패턴
원문링크: https://www.tradingview.com/chart/XAUUSD/7uLUVcIZ-How-to-use-trendline-to-identify-price-action-structure-pattern/
[본문뒤 추가문구] 서학개미 투자포럼 - 해외투자 트렌드의 중심


