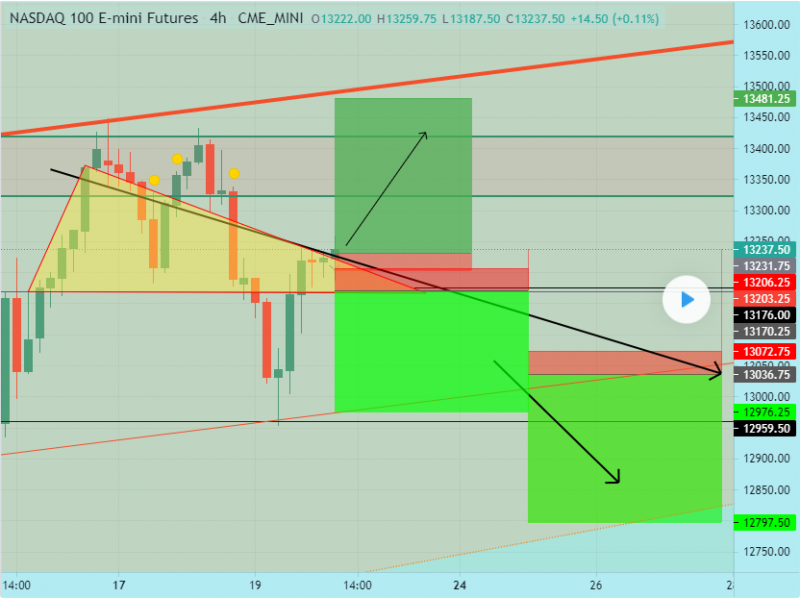
[선물] 나스닥 브레이크아웃 / NASDAQ BREAKOUT
 선물개미
0
2073
2021.05.20 17:28
NASDAQ 100 E-mini Futures
LION_KING_FX
Triangles provide an effective measuring technique for trading the breakout, and this technique can be adapted and applied to the other variations as well.
The ascending triangle pattern is similar to the symmetrical triangle except that the upper trendline is flat and the lower trendline is rising. This pattern indicates that buyers are more aggressive than sellers as price continues to make higher lows. Price approaches the flat upper trendline and with more instances of this, the more likely it is to eventually break through to the upside.
The descending triangle pattern on the other hand, is characterized by a descending upper trendline and a flat lower trendline. This pattern indicates that sellers are more aggressive than buyers as price continues to make lower highs
Its important to note that finding the perfect symmetrical triangle is extremely rare and that traders should not be too hasty to invalidate imperfect patterns. Traders ought to understand that triangle analysis is less about finding the perfect pattern and more about understanding what the market is communicating, through price action.
번역:
나스닥 100 E-mini 퓨처스
라이온_킹_FX
삼각형은 브레이크아웃을 거래하는 데 효과적인 측정 기술을 제공하며, 이 기술은 다른 변형에도 적용 및 적용할 수 있습니다.
오름차순 삼각형 패턴은 대칭을 이루는 삼각형과 비슷합니다. 단, 위쪽 추세선이 평평하고 아래쪽 추세선이 상승한다는 점이 다릅니다. 이 같은 패턴은 가격이 계속 하락하면서 매도자보다 매수자가 더 공격적이라는 의미다. 가격은 평탄한 상위 추세선에 접근하며, 이러한 사례가 많을수록 결국 상승세로 돌파할 가능성이 높다.
반면에 내림차순 삼각형 패턴은 내림차순 추세선과 평평한 하부 추세선이 특징입니다. 이 패턴은 가격이 계속 하락하면서 판매자가 구매자보다 더 공격적이라는 것을 나타낸다.
완벽한 대칭 삼각형을 찾는 일은 극히 드물며 거래자들이 불완전한 패턴을 무효화하도록 너무 성급하게 해서는 안 된다는 점에 유의해야 한다. 거래자들은 삼각관계 분석이 완벽한 패턴을 찾는 것이 아니라 시장이 가격 조치를 통해 무엇을 전달하고 있는지를 이해하는 것이 더 중요하다는 것을 이해해야 한다.
원문링크: https://www.tradingview.com/chart/NQ1!/zQVKXKxc-NASDAQ-BREAKOUT/
[본문뒤 추가문구] 서학개미 투자포럼 - 해외투자 트렌드의 중심


