[선물] XAU/USD:파형분석 / XAU/USD: wave analysis
 선물개미
0
2044
2021.05.21 16:49
Gold Spot / U.S. Dollar
KirkBarton
The pair may grow.
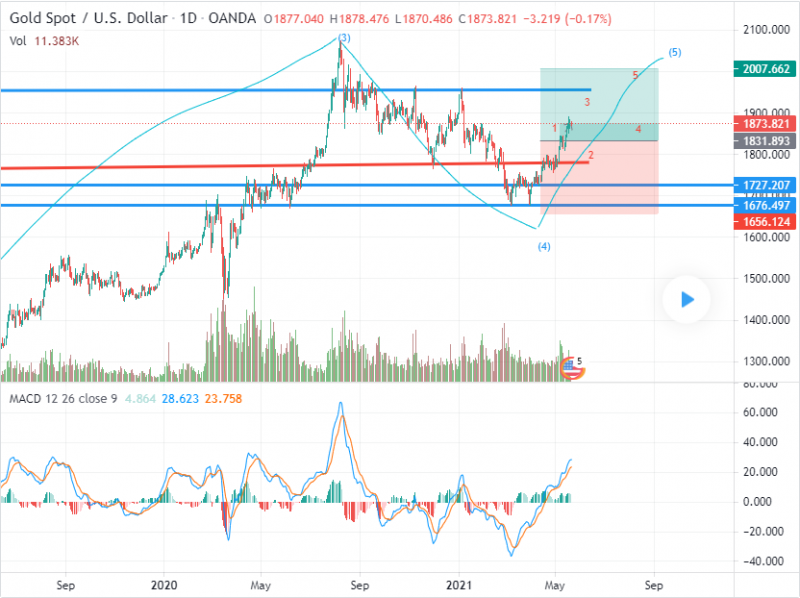
On the daily chart , the third wave of the higher level (3) formed, a downward correction developed as the fourth wave (4), and the formation of the fifth wave (5) started. Now, the first wave of the lower level 1 of (5) has formed, and a local correction is starting to develop as the wave 2 of (5). If the assumption is correct, after the end of the correction, the pair will grow to the levels of 1958.98–2067.60. In this scenario, critical stop loss level is 1780.79.
On the daily chart , the third wave of the higher level (3) formed, a downward correction developed as the fourth wave (4), and the formation of the fifth wave (5) started. Now, the first wave of the lower level 1 of (5) has formed, and a local correction is starting to develop as the wave 2 of (5). If the assumption is correct, after the end of the correction, the pair will grow to the levels of 1958.98–2067.60. In this scenario, critical stop loss level is 1780.79.
번역:
골드 스폿/미국 달러
커크 배턴
그 한 쌍은 자랄 수 있다.
일간 차트에서는 상위 레벨(3)의 제3파가 형성되고, 제4파(4)가 되면서 하향 보정이 발달했으며, 제5파(5)의 형성이 시작되었다. 이제 (5)의 하위 1단계의 첫 번째 파도가 형성되었고, (5)의 2단계에 따라 국소 교정이 발달하기 시작하고 있다. 가정이 맞으면 수정이 끝난 후 쌍은 1958년 수준으로 증가합니다.98–2067.60. 이 시나리오에서 임계 정지 손실 수준은 1780.79이다.
원문링크: https://www.tradingview.com/chart/XAUUSD/7bgZhDD0-XAU-USD-wave-analysis/
[본문뒤 추가문구] 서학개미 투자포럼 - 해외투자 트렌드의 중심


