[선물] XAUUSD 무릎 깨기 / Break XAUUSD's kneecaps
 선물개미
0
2082
2021.05.24 10:49
Gold Spot / U.S. Dollar
soaringtothestars
Multi Timeframe Analysis
Hint: Look only for sell setups
Recommendation:
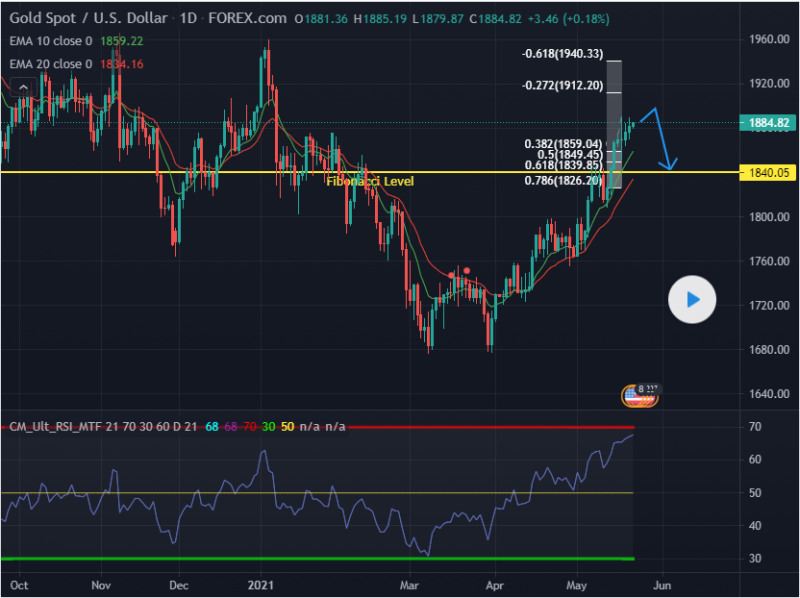
Price is woefully overbought on the daily timeframe . The 21 period daily RSI flirts with the 70 levels and hedge funds must commence profit taking on previous longs close to the clear order block at the 78.6% fibonacci levels.
Price will fall to this level prior to further potential upside. Be wary, that gold can fall deeper to 1770 due to DXY's potential upside surge.
Don't be caught off-guard. Break XAUUSD at the knees with a sell stop order below current market structure and take the surge down.
Take a market order position upon the confluence of valid entry rules on the 4H or 1H chart.
-=ENTRY RULES=-
Trading philosophy: Don’t short at the lowest of the bearish momentum nor do we long at the peak of a bullish impulse. The safest entries are at the end of a retrace on the 38.2%, 50%, 61.8% or 78.6% fibonacci back in the direction of the master trend.
Note: I use Daily/4H or 4h/1H market structures with wave analysis to prep for potential entries. The RSI , MACD and EMA indictors are confirmation for entries at the 4H or 1H timeframe
For SHORT:
4H chart should confirm that the bullish retrace had turned bearish in the direction of master trend. The MACD should have dropped below zero signifying a bearish environment. Price would have dropped below the 10 and 20 EMA . For good measure, check that the 4h and D1 RSI is below the 50 signal line
For LONG:
4H chart should confirm that the bearish retrace had turned bullish in the direction of the master trend. The MACD should have gone above zero signifying a bullish environment. Price had gone above the 10 and 20 EMA . For good measure, check that the 4h and D1 RSI is above the 50 signal line
I publish ideas on this Premium Account : https://www.tradingview.com/u/Tradeassoc... Follow me on both channels for updates.
번역:
골드 스폿/미국 달러
별까지 치솟는
다중 기간 분석
힌트: 판매 설정만 찾습니다.
권장 사항:
가격은 일별 기간에 비참하게 과대 구매되었다. 매일매일 RSI는 70레벨로 시시덕거리고 헤지펀드는 78.6% 피보나치 수준에서 명확한 주문 블록에 가까운 이전 기간 동안 이익을 취하기 시작해야 한다.
가격은 더 오를 가능성이 있기 전에 이 수준으로 떨어질 것이다. DXY의 잠재적 상승으로 인해 금은 1770까지 더 떨어질 수 있으므로 주의하십시오.
방심하지 마세요. 현재 시장 구조보다 낮은 판매 중지 명령으로 XAUUSD를 무릎에서 깨고 급상승률을 낮춥니다.
4H 또는 1H 차트에서 유효한 엔트리 규칙의 혼합에 대한 시장 주문 위치를 차지합니다.
-=ENTERGE ROULES=-
무역철학: 약세 기세의 최저치를 줄이지 말고, 우리는 강세 충동의 절정을 갈망하지도 말라. 가장 안전한 항목은 38.2%, 50%, 61.8% 또는 78.6% 피보나치(fibonacci)의 역추적 끝에 있는 것이다.
참고: Daily/4을 사용합니다.잠재적 진입을 대비하기 위한 파동 분석이 있는 4시간/1시간 시장 구조 또는 RSI, MACD 및 EMA 기구는 4H 또는 1H 시간대의 입력에 대한 확인 사항입니다.
요점:
4H 관리도는 강세 반전이 마스터 트렌드 방향으로 약세로 돌아섰음을 확인할 것이다. 약세 환경을 나타내는 MACD가 영하로 떨어졌어야 했다. 가격이 10 및 20 EMA 이하로 떨어졌을 것입니다. 적절한 측정을 위해 4h 및 D1 RSI가 50 신호 라인 아래에 있는지 확인하십시오.
긴 시간:
4H 관리도는 약세의 후퇴가 마스터 트렌드 방향으로 강세로 돌아섰음을 확인할 것이다. MACD는 강세 환경을 나타내는 영점 이상으로 올라갔어야 했다. 가격이 10 및 20 EMA를 초과했습니다. 좋은 측정을 위해 4h 및 D1 RSI가 50 신호 라인보다 높은지 확인하십시오.
프리미엄 계정에 대한 아이디어를 게시합니다. https://www.tradingview.com/u/Tradeassoc... 업데이트하려면 두 채널 모두 저를 따라오세요.
원문링크: https://www.tradingview.com/chart/XAUUSD/yr5VjIxX-Break-XAUUSD-s-kneecaps/
[본문뒤 추가문구] 서학개미 투자포럼 - 해외투자 트렌드의 중심


